
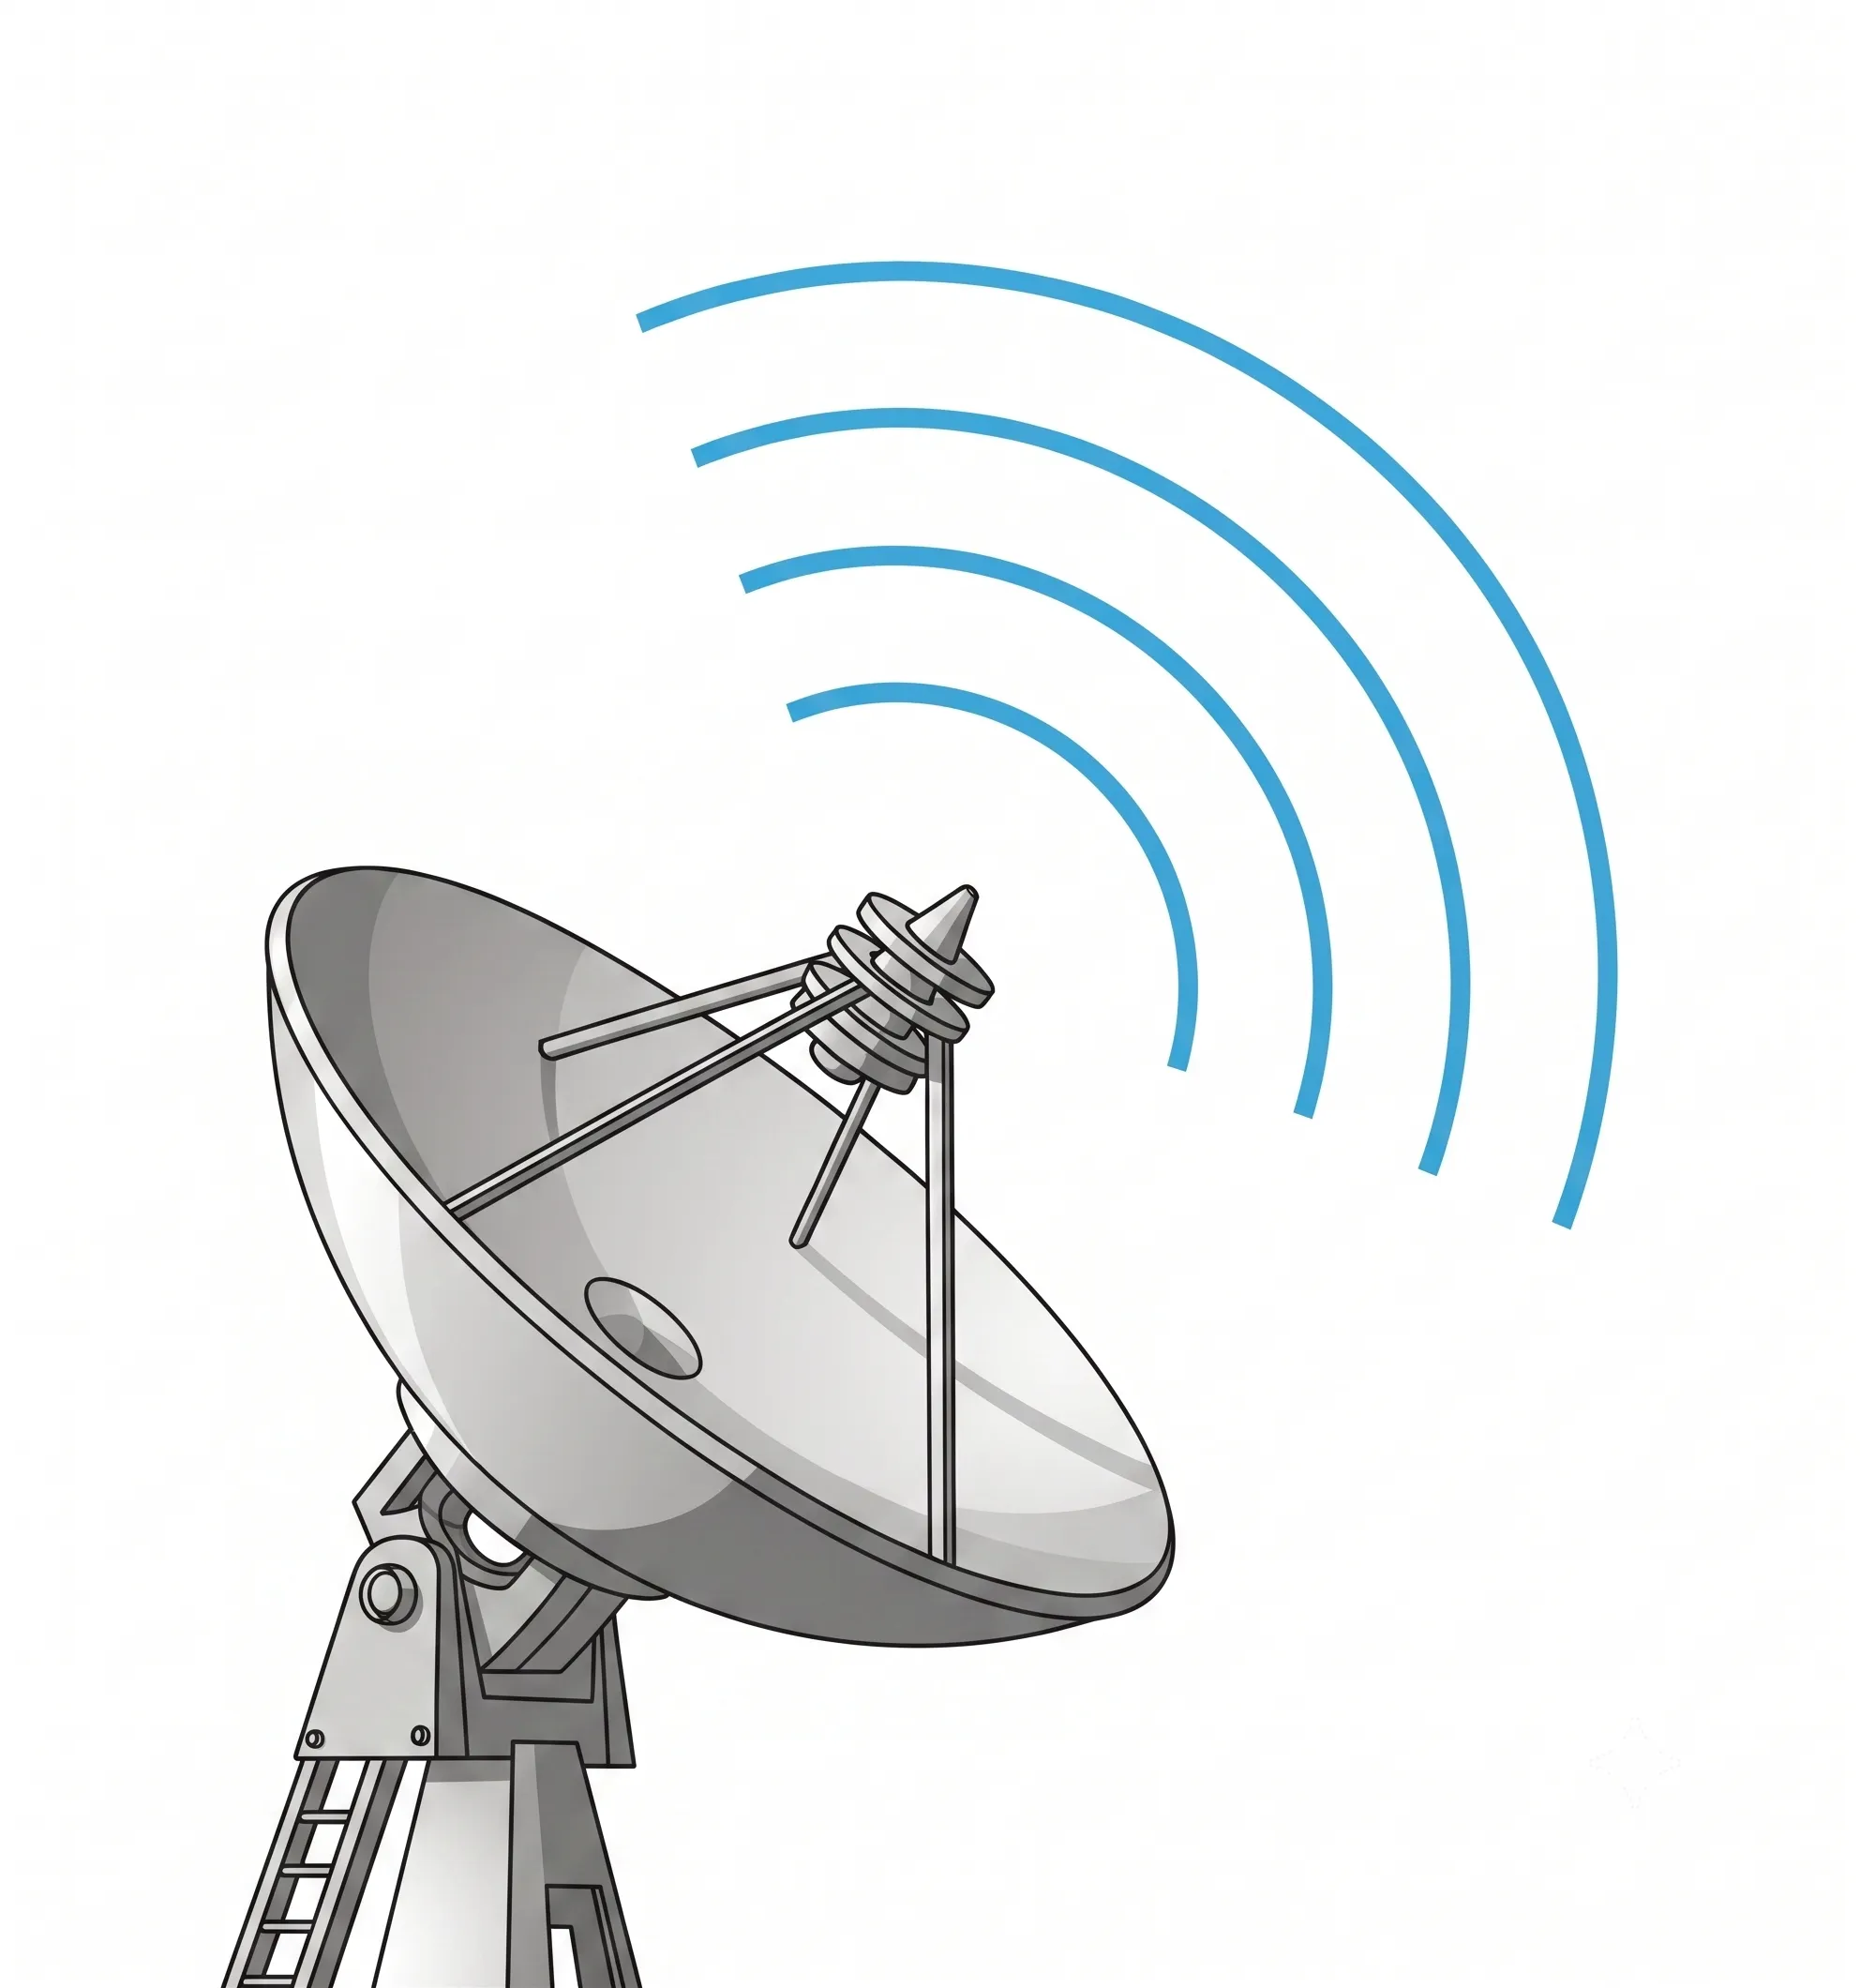
Ever wondered how massive amounts of satellite data reach us clearly? It's not as simple as pointing a dish, as signal loss and distortion are huge challenges.
Up/down conversion is crucial for satellite communication. It lets us use smaller antennas by transmitting at high frequencies. It also steps down the received frequency, preventing signal distortion and enabling accurate data recovery by the system's electronics.
This process might sound technical, but it's the backbone of reliable satellite links. I remember a new salesperson asking me this exact question. Understanding it is key to appreciating the engineering behind every clear satellite call or data stream. This process is not just a single step; it’s a carefully orchestrated journey for the signal, both on its way up to the satellite and on its way back down. Let's break down why this journey is so important.
Why do satellites need to up-convert signals before transmitting?
Sending a signal from the ground to a satellite faces a huge challenge: distance and atmospheric interference. A weak, low-frequency signal would simply get lost or require an impractically large antenna.
Satellites up-convert signals to transmit at higher frequencies, like the Ka-band1. This allows for smaller, more efficient antennas on both the ground and the satellite. Higher frequencies also provide wider bandwidth2, enabling faster data transmission rates for modern communication demands.
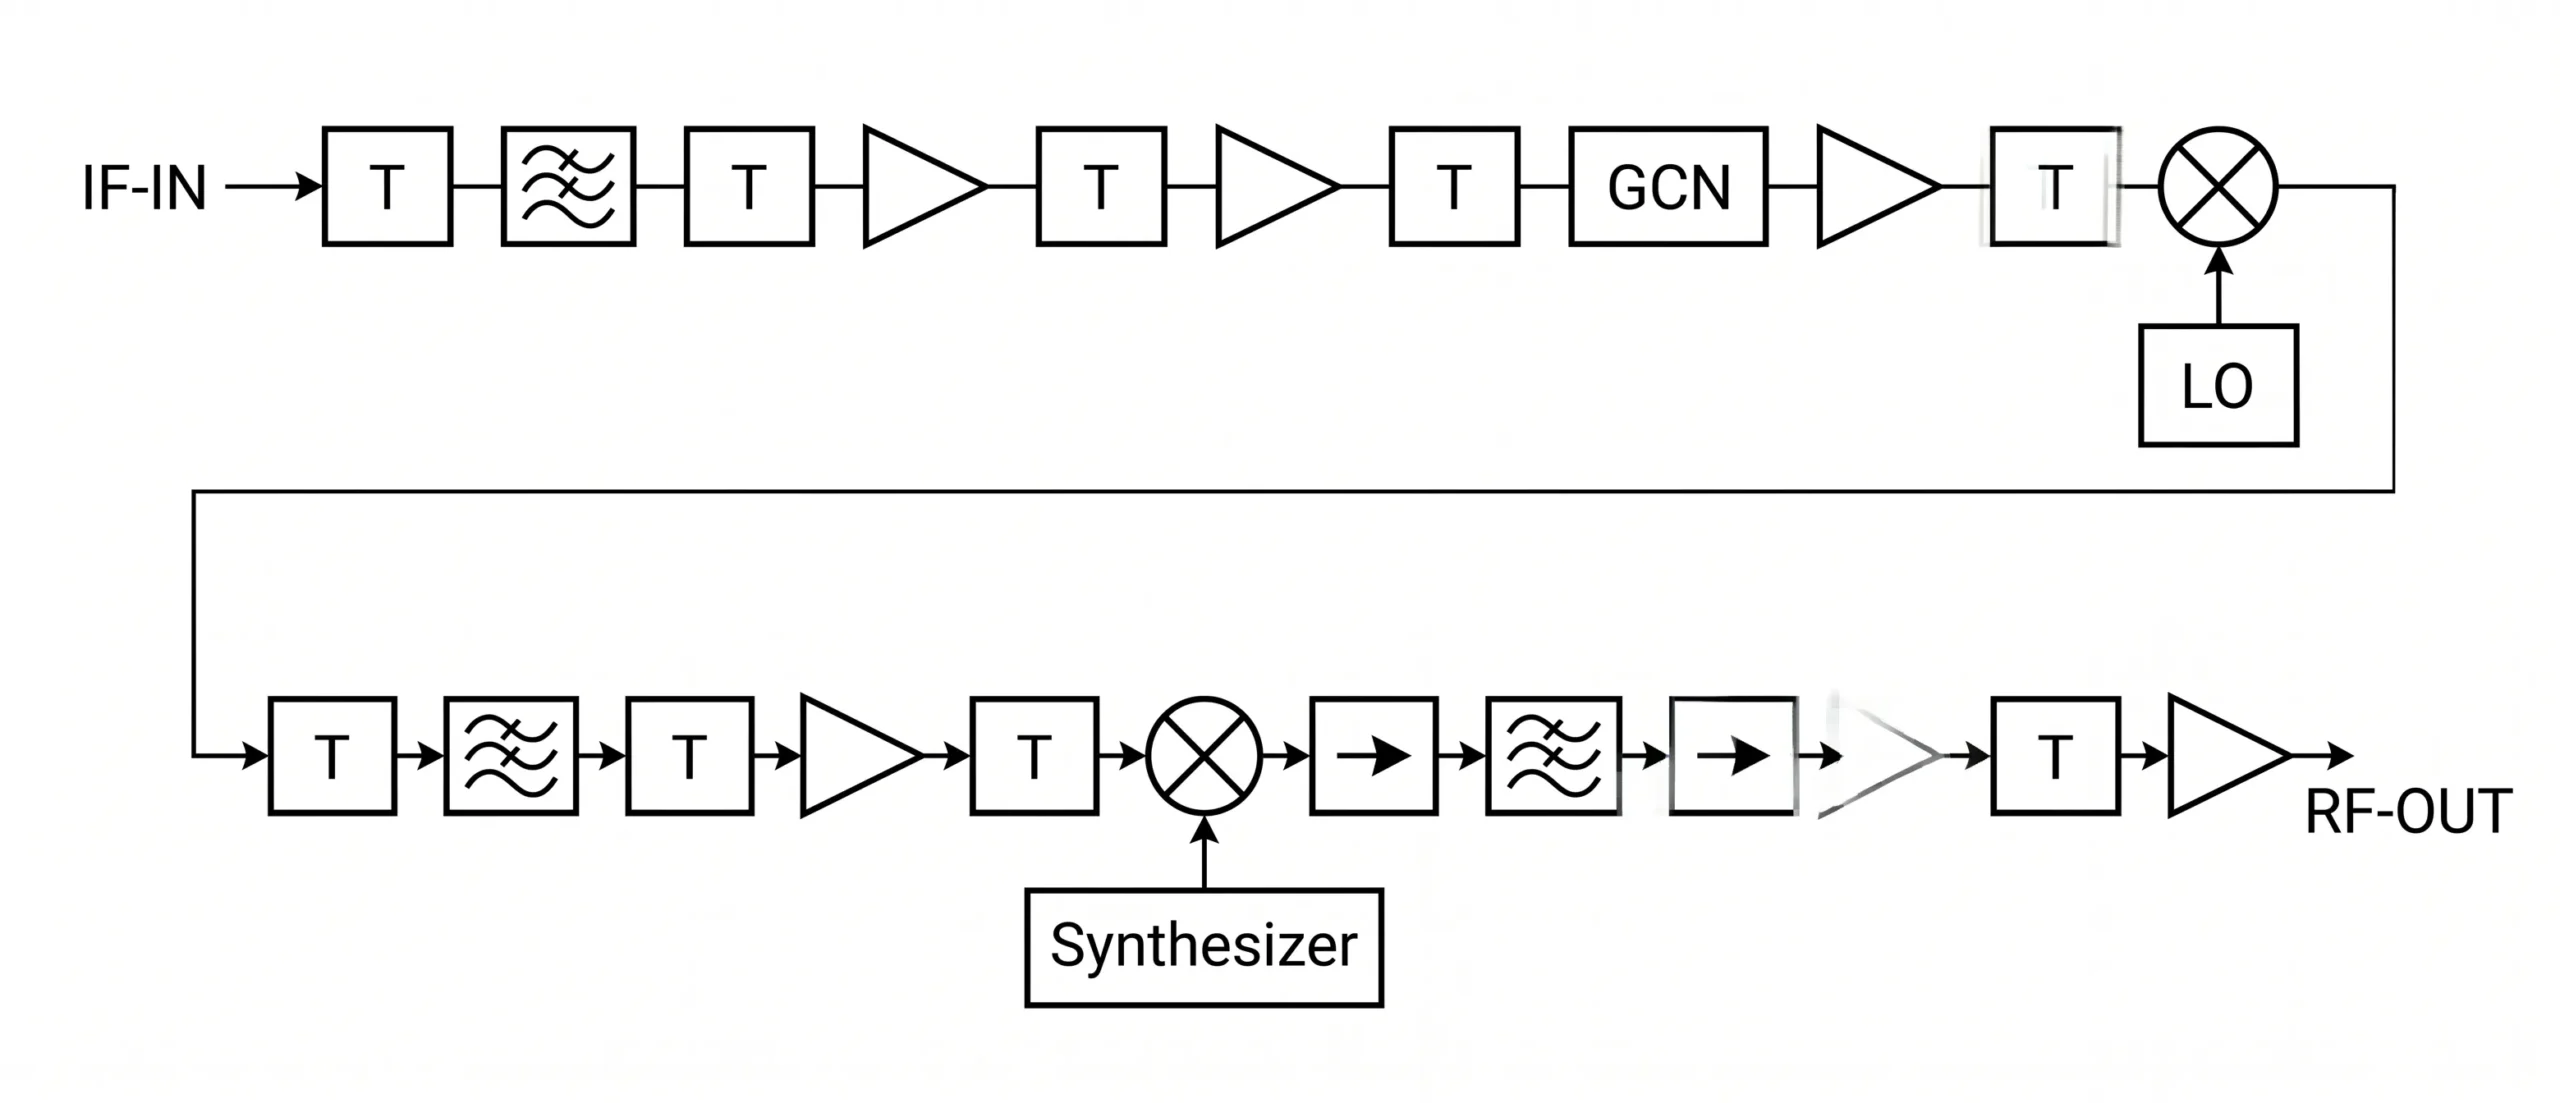
When we design a satellite communication system, our first goal is to get the signal from the ground station to the satellite efficiently. This process is called the uplink. The magic here is up-conversion, which is usually done by a component called a Block Upconverter, or BUC. We convert the signal from a lower intermediate frequency (IF) to a much higher radio frequency (RF), like the Ku or Ka-band.
There are a few critical reasons for this. First, antenna size is inversely proportional to frequency3. A higher frequency means a shorter wavelength, which allows for a smaller, lighter, and more focused antenna to achieve the same gain. This is vital for satellites, where size and weight are everything. Second, higher frequency bands offer significantly more bandwidth. Think of it like a highway; a wider highway can handle more traffic. This wider bandwidth is what enables high-speed satellite internet, 4K video streaming, and other data-intensive applications. Finally, the up-conversion process is paired with powerful amplification. After converting the signal to its final high frequency, it passes through a High Power Amplifier (HPA). At Safari Microwave, we develop products for this exact application, like our 3000-watt saturated power amplifier, which gives the signal the brute force it needs to travel thousands of kilometers through the atmosphere and space without getting lost in noise.
Why is a multi-stage down-conversion process so important for receivers?
A high-frequency signal arrives from a satellite, packed with data. But your receiver's electronics can't process it directly, as it would be completely overwhelmed by the speed of the signal.
Multi-stage down-conversion is vital for receivers. It systematically lowers the high-frequency satellite signal to an intermediate frequency (IF) that the Analog-to-Digital Converter (ADC) can handle. This prevents signal distortion and ensures the original data can be accurately demodulated.
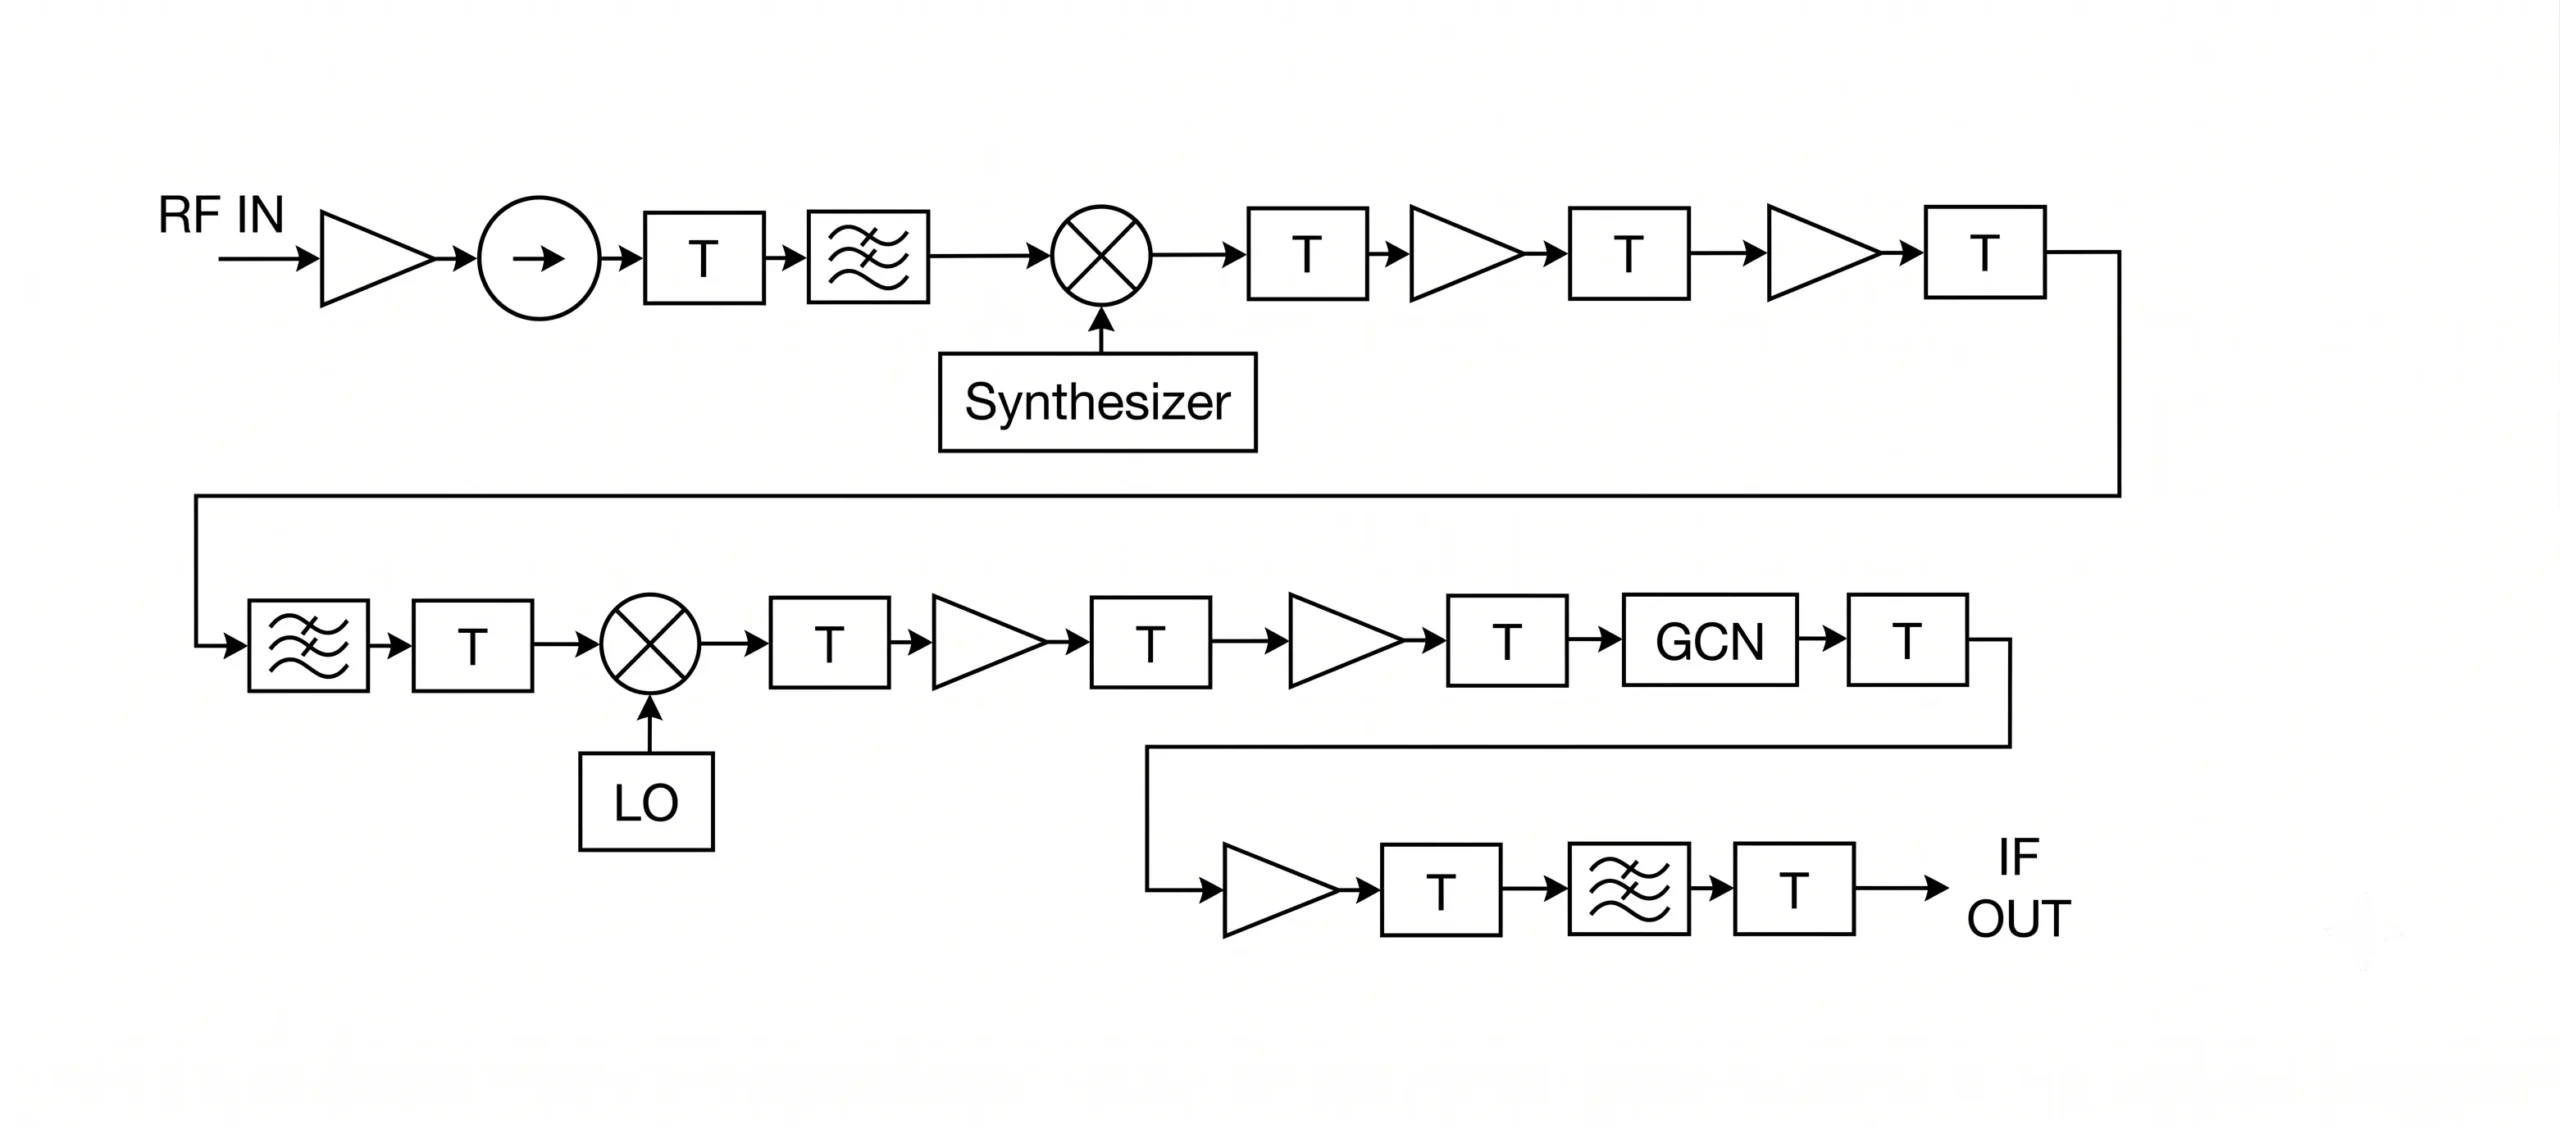
Once the signal completes its journey from the satellite, the receiver has the difficult job of turning it back into usable data. You can't just feed a 20 GHz Ka-band signal directly into a digital processor. The Analog-to-Digital Converter (ADC), the component that translates the analog wave into digital ones and zeros, would need to sample at an impossibly high rate. This would not only be extremely expensive but would also introduce massive signal distortion, making data recovery impossible. This is why we use a careful, two-stage down-conversion process, often performed by a Low-Noise Block downconverter (LNB).
Stage 1: The First Frequency Drop
The first step is to bring the high RF frequency down to a more manageable first Intermediate Frequency (IF), often around 4 GHz. This is done by mixing the incoming signal with a signal from a local oscillator. A critical part of this stage is filtering out the "image frequency"—an unwanted byproduct of the mixing process that can corrupt the real signal4.
Stage 2: Getting Ready for Digital
Even 4 GHz is too high for most ADCs. So, a second stage of mixing and filtering brings the signal down to the L-band (around 1-2 GHz). This final IF is well within the capabilities of modern ADCs. This controlled, two-step approach is how we maintain excellent signal integrity. As I explained to my team, this precision is what allows us to control the Error Vector Magnitude (EVM)5 to within 2.5%, a key measure of signal quality. This process starts with our ultra-low noise amplifiers (LNAs), some with a noise figure as low as 0.5 dB, ensuring the faint satellite signal is cleanly amplified from the very start.
How can you be sure your converter design will work in the real world?
Designing complex frequency converters on paper is one thing. You can make all the calculations you want, but the real world has other plans. Small imperfections can ruin performance.
We verify our converter designs using advanced computer simulation software. This allows us to model the entire signal chain, predict performance, and identify potential issues like signal distortion or interference before manufacturing. This virtual testing ensures the final product meets exact specifications.
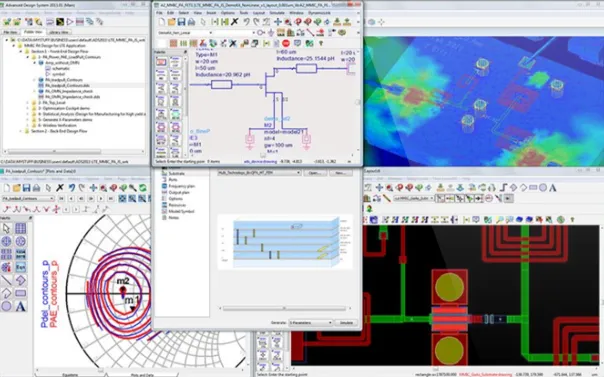
Building and testing physical prototypes is slow and expensive. A tiny miscalculation in the design phase can lead to a cascade of problems, wasting time and resources. That's why we rely heavily on computer simulation to test and perfect our converter designs before a single component is soldered6. We create a digital twin of the entire converter system. We use precise models for every component in the signal path, from the mixers and filters to our own high-performance amplifiers and PIN diode switches. Because we design and manufacture these components, we can use their exact measured performance data (S-parameters) in our simulations for unmatched accuracy. This virtual environment allows us to run exhaustive tests and analyze key performance metrics.
| Metric Analyzed | What It Tells Us | Why It Matters |
|---|---|---|
| Gain & Flatness | Consistency of amplification across the band | Ensures all parts of the signal are treated equally. |
| Noise Figure (NF)7 | How much noise the system adds to the signal | A low NF is critical for receiving weak signals. |
| Linearity (P1dB, IP3)8 | How the system behaves at high power levels | Predicts and prevents signal distortion. |
| EVM | Overall signal quality and "cleanliness" | Directly impacts the data error rate. |
| Image Rejection | Effectiveness of the filters | Prevents unwanted signals from corrupting the data. |
Simulation lets us ask "what-if" questions. What happens if a component's value changes with temperature? What if the input power fluctuates? By simulating these real-world scenarios, we can build robust designs that are reliable in the field. This combination of deep engineering experience and modern simulation tools is how we ensure our products perform flawlessly from day one.
Conclusion
Up/down conversion is the smart engineering that makes satellite communication possible. It solves challenges from antenna size to signal processing, ensuring clarity across vast distances for our connected world.
"Ka band - Wikipedia", https://en.wikipedia.org/wiki/Ka_band. A source can define the Ka-band as a portion of the microwave spectrum, typically ranging from 26.5 to 40 gigahertz (GHz). It can also note its use in modern high-throughput satellites for applications like high-speed internet access and data backhaul. Evidence role: definition; source type: encyclopedia. Supports: The definition and application of the Ka-band in satellite communications.. ↩
"Data, Frequency, and Bandwidth: Understanding how They work",
. A source can confirm that higher frequency bands (like Ka-band) have larger spectral allocations available from regulatory bodies. This allows for wider channel bandwidths, which, according to principles like the Shannon-Hartley theorem, directly increases the theoretical maximum data rate (channel capacity). Evidence role: mechanism; source type: paper. Supports: The claim that higher frequencies offer wider bandwidth for faster data rates.. ↩"ELI5: Why antennas length need to be certain length in relation to ...", https://www.reddit.com/r/rfelectronics/comments/1go261q/eli5_why_antennas_length_need_to_be_certain/. A source can explain that the physical size of an effective antenna is directly related to the wavelength of the signal it transmits or receives. Since wavelength is inversely proportional to frequency (λ = c/f), higher frequencies have shorter wavelengths, allowing for physically smaller antennas to achieve the same gain and directivity. Evidence role: mechanism; source type: education. Supports: The claim that antenna size is inversely proportional to frequency.. ↩
"Radio Receiver Image Rejection - Electronics Notes", https://www.electronics-notes.com/articles/radio/radio-receiver-selectivity/image-rejection-response.php. A source can define the image frequency as an undesired input frequency that, when mixed with the local oscillator frequency in a superheterodyne receiver, produces the same intermediate frequency (IF) as the desired input signal. This creates interference, and an image-reject filter is therefore necessary before the mixer to attenuate this unwanted signal. Evidence role: definition; source type: encyclopedia. Supports: The definition of image frequency and the need for its removal.. ↩
"Error vector magnitude - Wikipedia", https://en.wikipedia.org/wiki/Error_vector_magnitude. A source can define Error Vector Magnitude (EVM) as a measure used to quantify the performance of a digital radio system by measuring the difference between the ideal constellation points of a transmitted signal and the actual received points. It is a comprehensive figure of merit for signal quality, as it is affected by noise, distortion, and phase noise, and is directly related to the system's bit error rate (BER). Evidence role: definition; source type: paper. Supports: The definition and importance of Error Vector Magnitude (EVM) as a signal quality metric.. ↩
"Why RF Engineers Need EM Simulation for Designing RF Circuits", https://www.dynamicengineers.com/content/why-rf-engineers-need-em-simulation-for-designing-rf-circuits. A source can describe how modern RF and microwave engineering relies extensively on computer-aided design (CAD) and simulation software. This practice allows engineers to model and analyze the behavior of complex circuits, including predicting performance metrics like gain, noise figure, and linearity, thereby reducing the number of costly and time-consuming physical prototype iterations. Evidence role: general_support; source type: paper. Supports: The use of computer simulation as a standard practice in modern RF engineering.. ↩
"Noise figure", https://en.wikipedia.org/wiki/Noise_figure. A source can define Noise Figure (NF) as a measure of the degradation of the signal-to-noise ratio (SNR) caused by components in a radio frequency signal chain. A lower noise figure indicates better performance, which is especially critical for the initial amplification stage (e.g., an LNA) in a receiver, as noise added at this stage is amplified by all subsequent stages. Evidence role: definition; source type: education. Supports: The definition of Noise Figure and its importance in receiver design.. ↩
"[PDF] P1dB vs OIP3 Relationship - Cross Technologies, Inc.", https://www.crosstechnologies.com/technical/P1dB%20vs%20OIP3%20Relationship.pdf. A source can define the 1 dB compression point (P1dB) as the output power level at which the amplifier's gain has dropped by 1 dB from its small-signal value, indicating the onset of saturation. The third-order intercept point (IP3) is a theoretical point that quantifies the amplifier's linearity with respect to third-order intermodulation distortion. Both are critical metrics for ensuring a system operates without significant signal distortion. Evidence role: definition; source type: education. Supports: The definition of P1dB and IP3 as key metrics for amplifier linearity.. ↩