
You see terrible intermodulation distortion1 (IMD) results on the screen, and they don't match the datasheet. Is your expensive new amplifier a dud? It's a frustrating and costly problem.
To accurately measure IMD, you must use the spectrum analyzer's internal attenuator. By increasing the input attenuation by 10 dB, check if the measured IMD products drop. If they drop by much more than 10 dB, they are being generated inside the analyzer, not by your device.
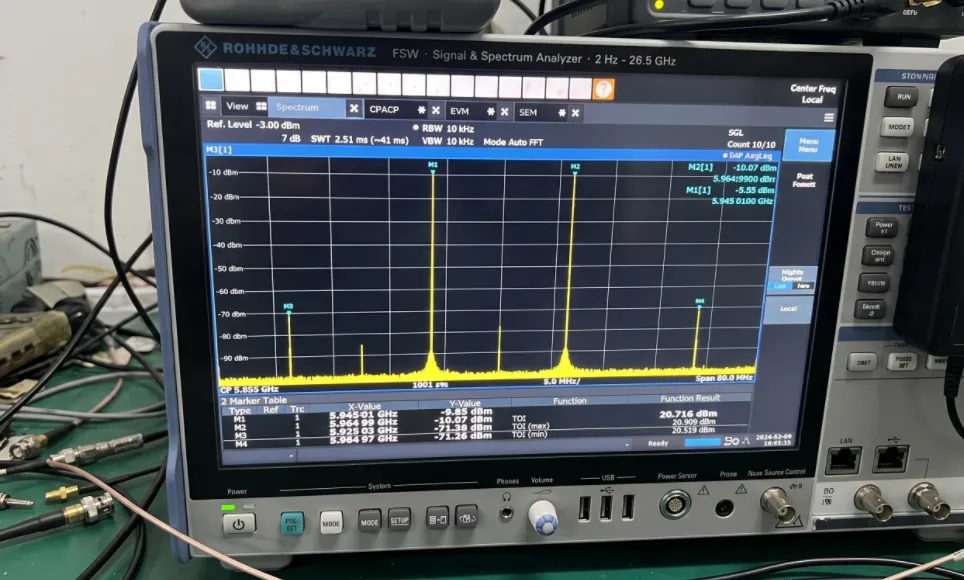
I'll never forget the time I was at a client's lab. He pointed to the spectrum analyzer2 screen and told me, "Your amplifier's IMD specs are not good." I knew that amplifier was solid. Our R&D and production test teams had both signed off on it. So, what was wrong? I checked the instrument's calibration date3 and even rebooted it, but the ugly IMD spurs remained. I started checking all the settings—RBW, detector type—everything looked fine. Then, on a hunch, I increased the analyzer's internal attenuator. The IMD products on the screen dropped like a rock, way more than I expected. I was so relieved. That experience taught me a vital lesson: you have to know how to use your tools to tell the difference between real distortion and a measurement ghost. Let's break down how you can do the same.
Why Does the Spectrum Analyzer's Internal Attenuator Matter for IMD Measurements?
You see distortion on your screen and immediately blame your amplifier. You might waste hours troubleshooting the wrong part or even reject a perfectly good component because of a simple misunderstanding.
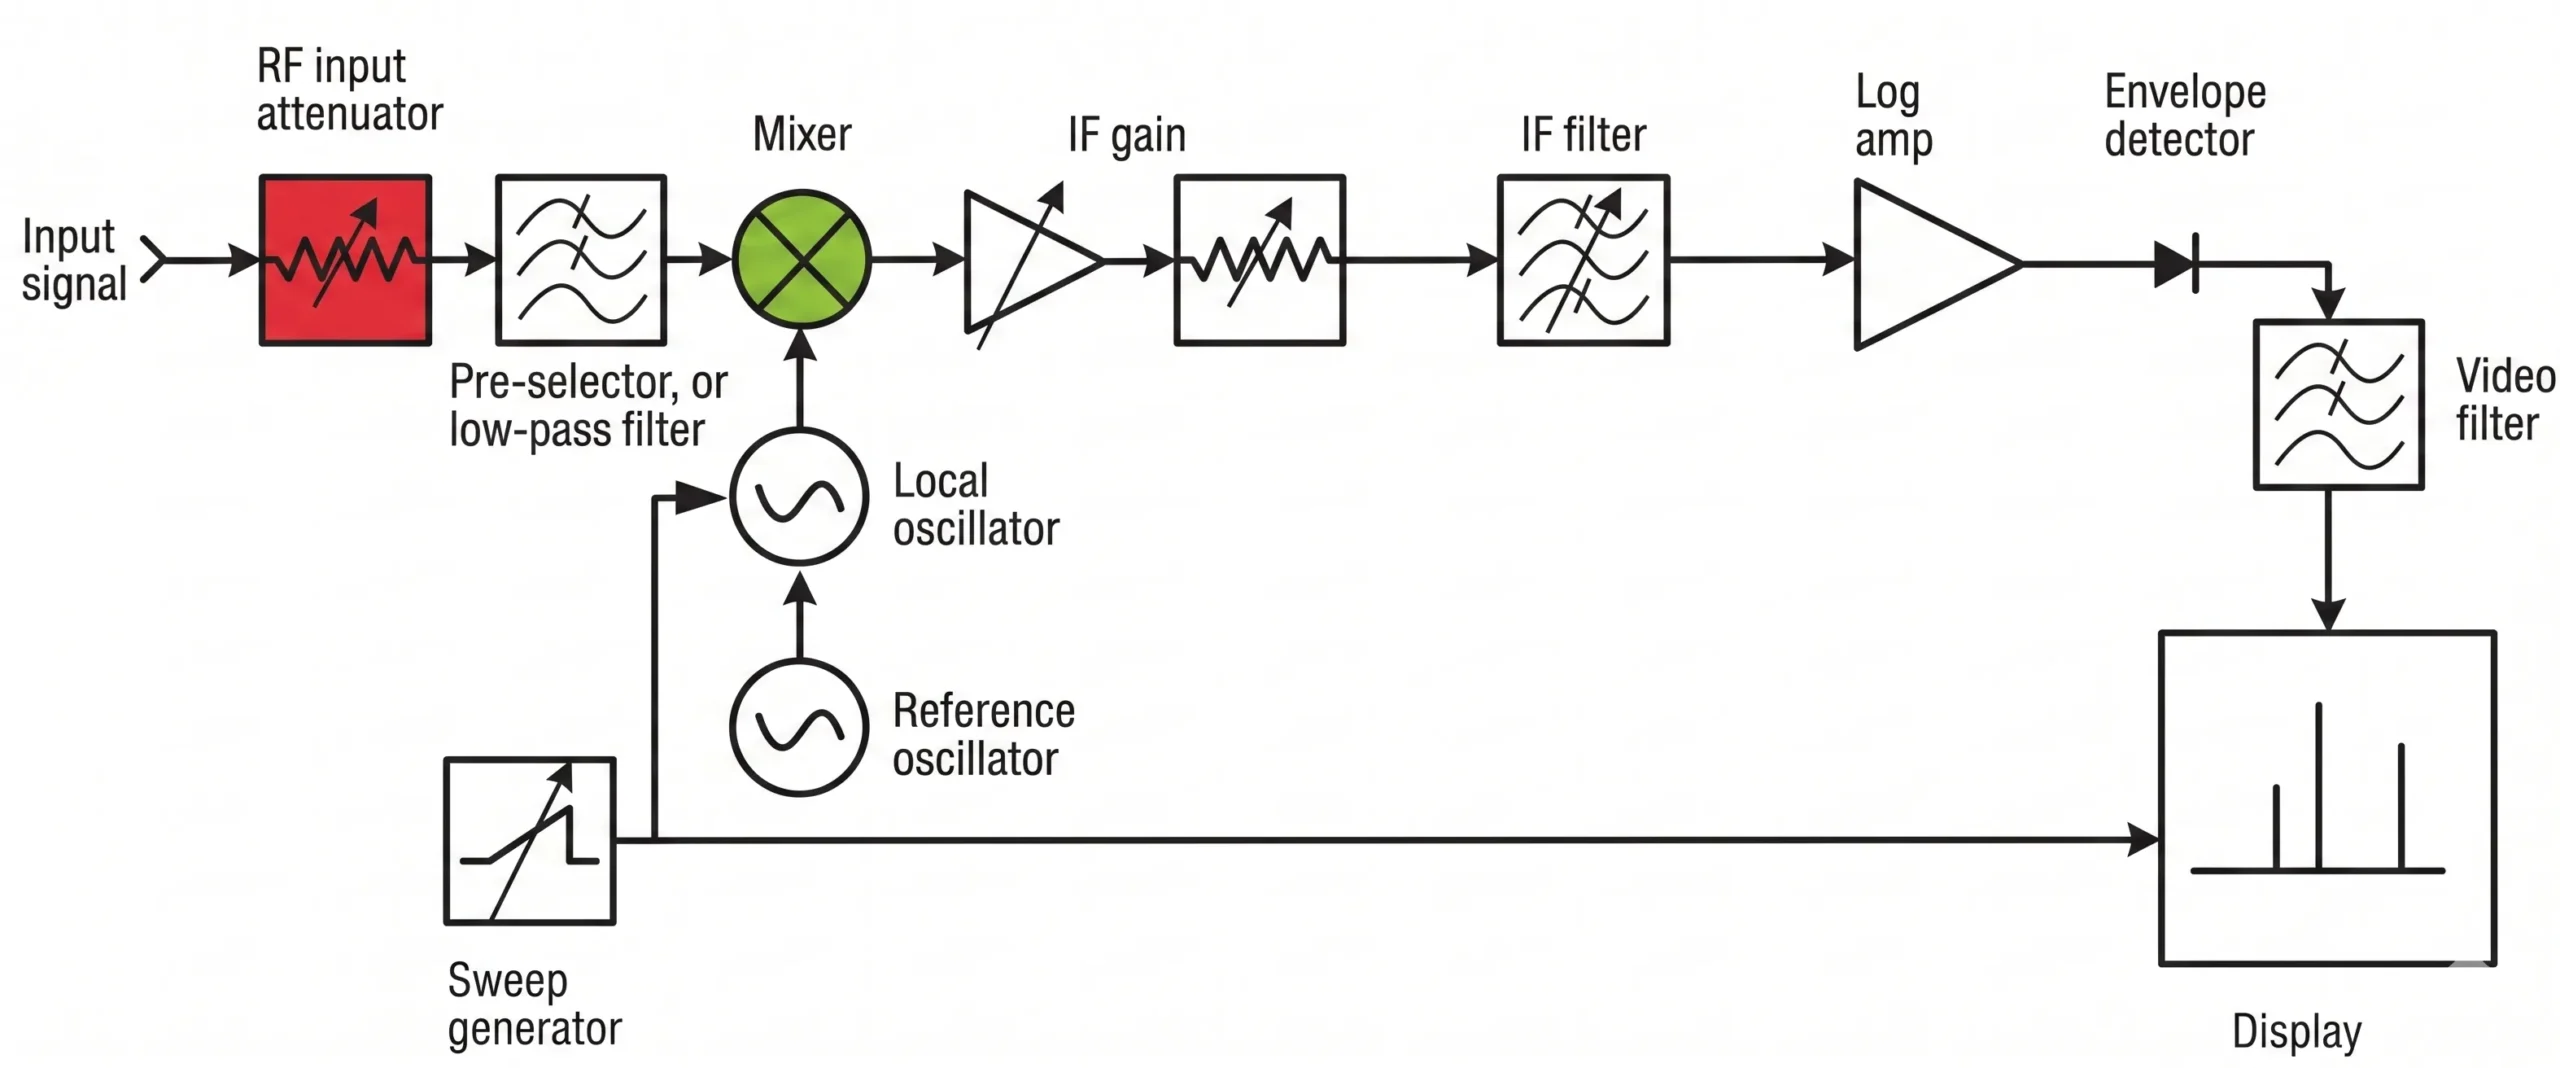
The internal attenuator4 is your first line of defense against false readings. It reduces the signal level hitting the analyzer's first mixer. If the IMD products5 drop by much more than the attenuation you add, they are being generated inside the analyzer, not by your Device Under Test (DUT).
The Role of the First Mixer
Every spectrum analyzer has a component called a mixer at its front end. The mixer's job is to down-convert the incoming RF signal to a lower, fixed intermediate frequency (IF) that the instrument can process. The problem is that no mixer is perfectly linear. If you hit it with too much power, the mixer itself will start to generate its own IMD products. These are measurement artifacts. They are ghosts created by your test instrument, not real signals from your DUT. Your powerful amplifier might be perfectly clean, but it's overdriving the analyzer's input stage, making it look bad. This is a very common trap for engineers testing high-power devices.
The Attenuator Test Explained
This is where the internal attenuator becomes your best friend. It's a simple switchable pad that sits right before the first mixer. By adding attenuation, you reduce the power level that the mixer sees. Let's say you add 10 dB of attenuation.
- If the IMD products are real and coming from your DUT, they will drop by exactly 10 dB on the screen, just like the main tones.
- If the IMD products are being generated by the analyzer's mixer, they will drop by much more. For third-order products (IMD3), they will drop by 30 dB!
This difference is the key to identifying the source of the distortion.
| Attenuator Change | Real DUT IMD Change | Analyzer-Generated IMD Change |
|---|---|---|
| Increase by 10 dB | Signal drops by 10 dB | Signal drops by 20 dB (IMD2), 30 dB (IMD3) |
| Decrease by 10 dB | Signal rises by 10 dB | Signal rises by 20 dB (IMD2), 30 dB (IMD3) |
The goal is to add just enough attenuation to stop the analyzer from generating its own distortion, but not so much that the real IMD products from your DUT fall into the noise floor6.
What Other Analyzer Settings Affect IMD Measurement Accuracy?
You've figured out the attenuator, but your readings still seem inconsistent or noisy. Getting the attenuator right is a huge step, but other settings can still hide the true performance of your device.
Beyond the attenuator, your Resolution Bandwidth7 (RBW), video bandwidth8 (VBW), and detector choice are critical. A narrow RBW is essential to separate signals and lower the noise floor, but it makes sweeps slower. Using the "Peak" detector ensures you capture the true amplitude of the IMD products.
Resolution Bandwidth (RBW) and Noise Floor
The Resolution Bandwidth filter is what allows your analyzer to tell the difference between signals that are close together in frequency. For measuring IMD, you need an RBW that is narrow enough to clearly separate the small IMD spurs from your two large primary tones. A common rule is to set the RBW to about 1% of the frequency spacing between your tones. A second benefit of a narrow RBW is that it lowers the analyzer's displayed average noise level (DANL). Lowering the RBW by a factor of 10 will drop the noise floor by 10 dB, which can make the difference between seeing your IMD product and having it buried in noise. The trade-off is sweep time; a narrower RBW means the analyzer has to sweep more slowly to get an accurate reading.
Detector Type, VBW, and Averaging
The detector determines how the analyzer processes the signal at each frequency point to display a trace. For measuring distortion products, you should always use the Peak detector. This ensures you capture the maximum level of the spur, even if it fluctuates. Using an "Average" detector might under-report the true level of the distortion.
The Video Bandwidth (VBW) is a filter applied after the detector. It smooths the noise on the trace, making it easier to read. A good practice is to set the VBW to be less than or equal to 0.1 times the RBW (e.g., if RBW is 10 kHz, set VBW to 1 kHz). This provides good smoothing without distorting the actual measurement of the peak. Finally, use Trace Averaging9 to further reduce random noise and get a stable, repeatable measurement of low-level signals.
| Setting | Recommendation for IMD | Reason |
|---|---|---|
| Attenuator | Adjust until IMD levels stabilize | Prevents analyzer overload |
| RBW | Narrow (e.g., 1% of tone spacing) | Resolves signals and lowers noise floor |
| VBW | ≤ 0.1 x RBW | Smooths trace noise without affecting peaks |
| Detector | Peak | Captures the true maximum of the IMD product |
| Averaging | Use Trace Averaging (e.g., 10-100 averages) | Reduces random noise for clearer signals |
How Can I Be Sure My Test Setup Itself Isn't Generating IMD?
You've mastered your analyzer's settings, but something still feels off. What if the distortion isn't from the DUT or the analyzer, but from the test equipment in between?
Your cables, connectors, or even your signal sources10 could be the hidden culprits. They can introduce distortion before the signal even reaches your DUT. A simple "back-to-back" test is essential.
To check your setup, remove the DUT and connect your signal path directly to the spectrum analyzer (using a fixed attenuator if needed). Any IMD products you see now are from your equipment, not your DUT. This establishes your measurement's true noise floor.
The Importance of High-Quality Components
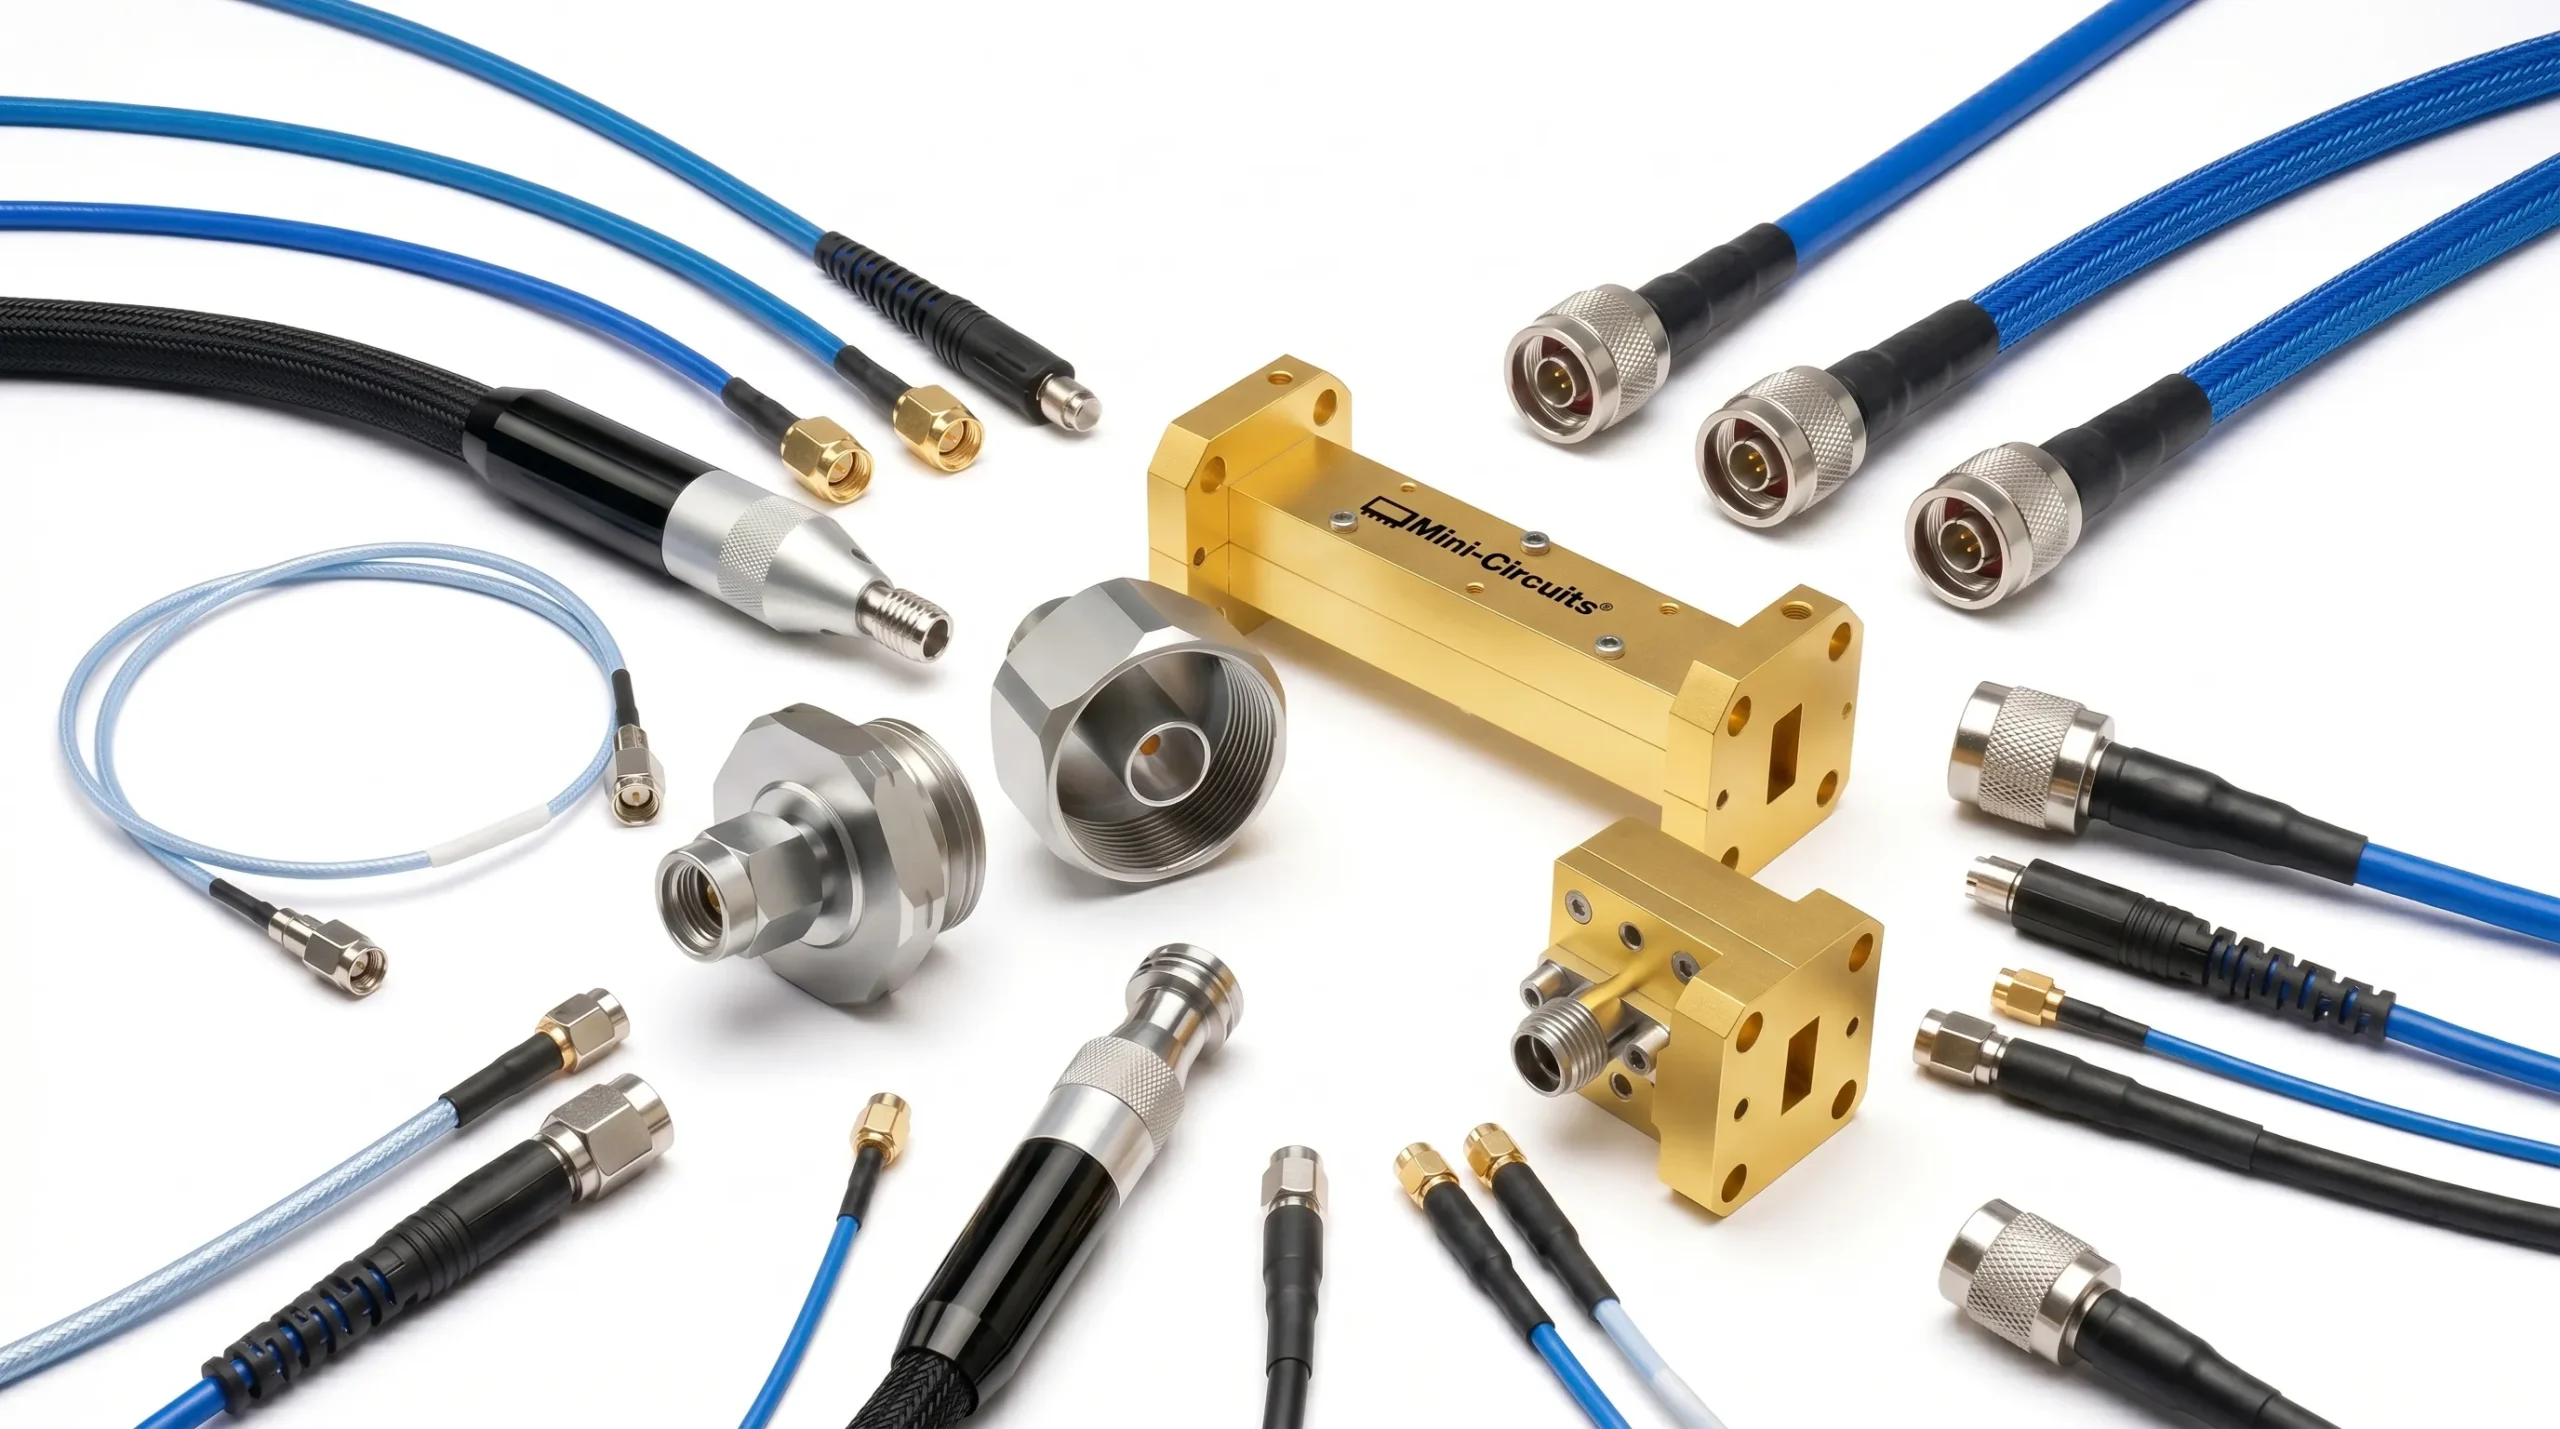
It's easy to forget that even passive components like cables and adapters can be non-linear, especially when dealing with the high power levels used in IMD testing. A cheap, poorly shielded cable or a slightly loose or dirty connector can act like a diode, generating its own distortion. This is why we always use high-performance, phase-stable cables and high-power terminations in our lab. We also insist on using a torque wrench to tighten connectors to the manufacturer's specification. A connection that is too loose or too tight can create unwanted reflections and distortion. Don't let a $10 cable ruin the measurement of a $10,000 amplifier. Your measurement setup is only as good as its weakest link.
Performing a System Residual IMD Test
Before you ever connect your DUT, you should characterize your test system's own distortion. This is called a system residual IMD test, or a "back-to-back" measurement.
- Set up your two-tone signal sources and combiner just as you would for the actual test.
- Instead of connecting the DUT, connect the output of your combiner directly to your spectrum analyzer setup. Be sure to include any external pads or circulators you plan to use in the final test.
- Set the power levels to the same level your DUT will see.
- Measure the IMD products on the spectrum analyzer.
The level you measure is the "residual IMD" of your test system. For your DUT measurement to be valid, the IMD it generates must be at least 10 dB higher than this system residual level. If it's not, you are measuring more of your test setup than your actual device. This step gives you the confidence that what you measure later is the true performance of your DUT.
Conclusion
Accurate IMD measurement is more than just connecting a DUT. You must master your spectrum analyzer's attenuator, optimize its settings, and always verify your test setup to reveal true performance.
Understanding IMD is crucial for audio engineers to ensure high-quality sound reproduction. ↩
Explore how spectrum analyzers function to accurately measure and analyze signals. ↩
Learn about the significance of keeping your measurement instruments calibrated. ↩
Learn how internal attenuators help prevent false readings in signal measurements. ↩
Gain insights into the significance of IMD products in evaluating signal integrity. ↩
Learn about the noise floor's impact on the visibility of low-level signals. ↩
Learn about the importance of RBW in distinguishing between closely spaced signals. ↩
Explore how VBW settings can enhance the clarity of your measurement results. ↩
Discover how Trace Averaging can help reduce noise and improve measurement reliability. ↩
Explore the various signal sources that can be utilized in RF testing setups. ↩